
Paul H. Gobster, PhD, FASLA, is a senior research landscape architect with the U.S. Forest Service.
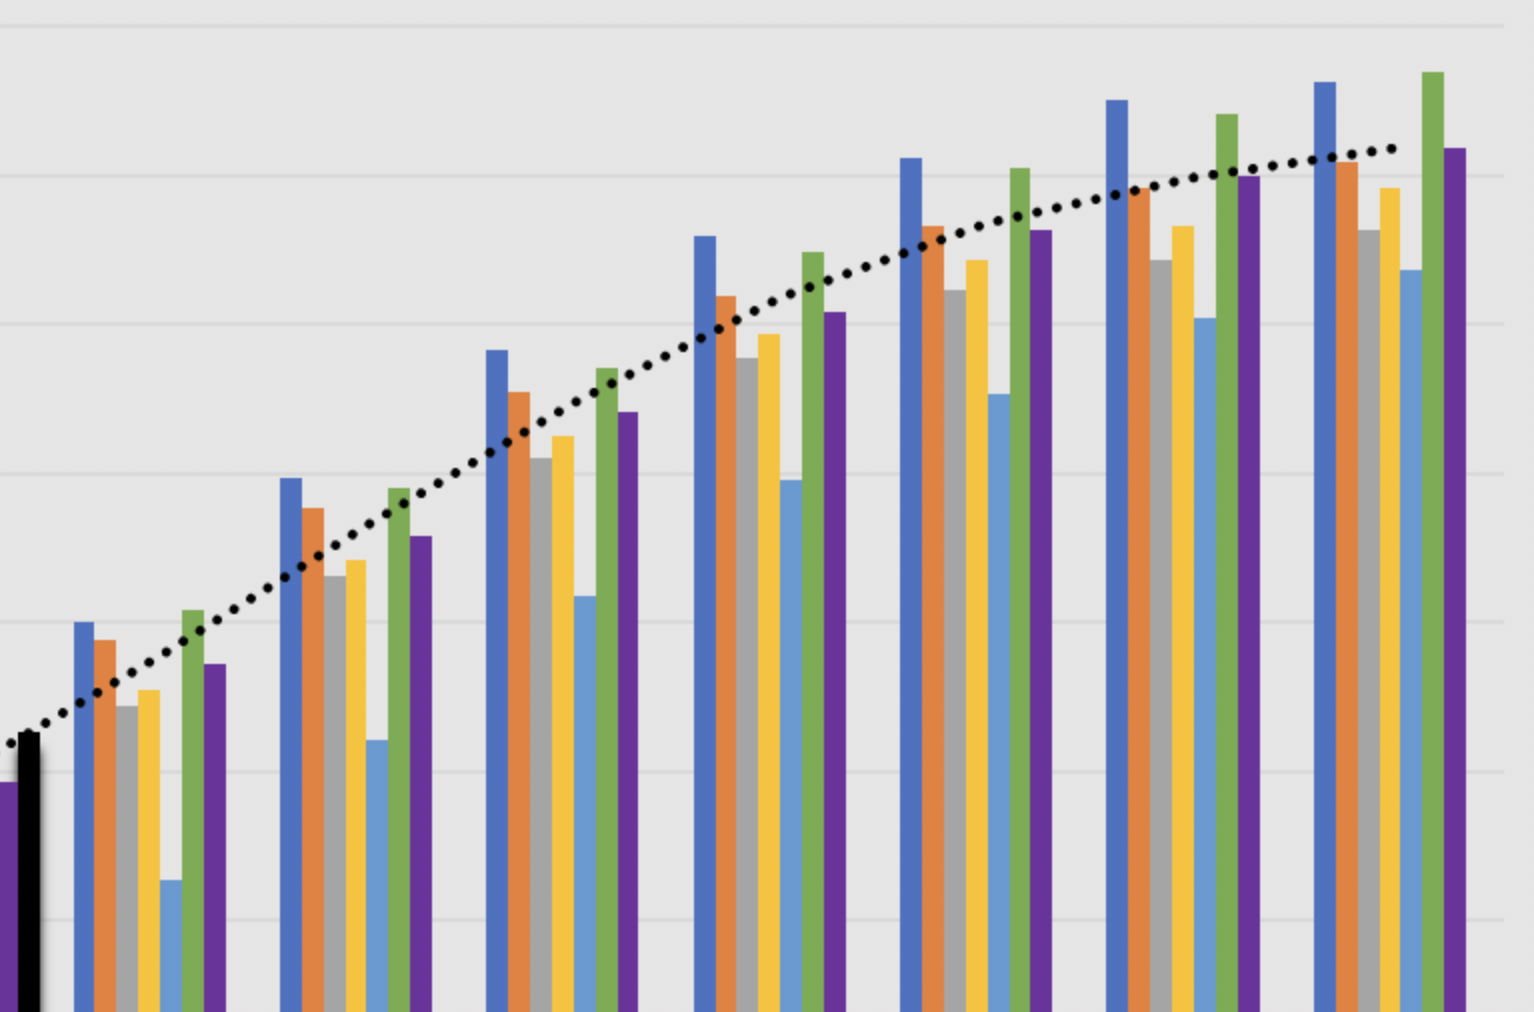
Use monitoring can be an important tool for managers of transportation and recreation facilities, to understand patterns and trends over time, quantify the benefits of public investment, and identify potential problems such as congestion. Since 2016, researchers at the U.S. Forest Service and University of Minnesota have been monitoring use of the Bloomingdale Trail in cooperation with the Chicago Park District and The Trust for Public Land, using bicycle-pedestrian counters mounted at two points near the east and west ends of the trail. Sometime this July, the 10 millionth person will pass by the eastern counter and while no fireworks will go off, it certainly will be a noteworthy event and testament to the success of the Bloomingdale Trail.
The graph below shows that average monthly counts on the trail follow a bell-shaped pattern that peaks in July. While monthly use rises closely in proportion to the rise in monthly average temperature, daily use can vary considerably as a function of temperature, precipitation, and day of week. Interestingly the top use days on the trail over the years have not been in July but in early spring when the first warm days bring throngs of people out of hibernation. Hourly use over the course of a day shows two distinct patterns, with weekend use peaking between 10 AM and 4 PM while weekday use peaks around 7 AM then drops during the day with a sharp increase between 5-8 PM reflecting people’s work and commuting schedules.
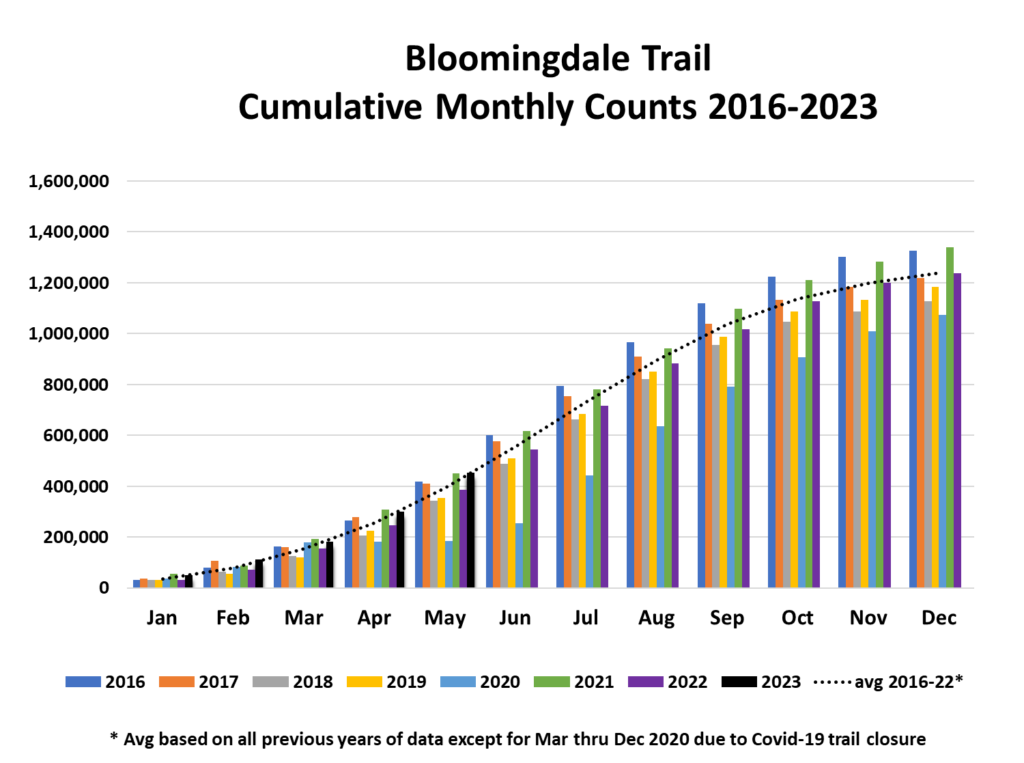
Describing and predicting trends in use is complex. In the first year of monitoring use counts topped 1.3 million, followed by declines the following 3 years. This could not be attributed to changes in local population or adverse weather and potential explanations included reactions to trail crowding or the wearing off of the novelty effect of the new trail. Then in 2020 the Covid pandemic occurred and record high use and lack of social distancing led to a shutdown of the trail on March 26. Reopening on June 18th under improved use guidelines, use rebounded above 2016 levels for the years 2020-2021 before declining slightly in 2022. So far, use levels for 2023 appear above the 2016-2022 average, though this may be due to warmer than average temperatures and a lack of rain. In any case, the variation in annual use has been less than 16% between the high of 1.34 million in 2021 to the low of 1.12 million in 2018, demonstrating continued high interest in the Bloomingdale Trail and its benefits to Chicago and the neighborhoods that surround it.